Tutorial 11 Analyzing the effects of peripheral nerve stimulation on rhythmic ENG activity
11.1 General points to know prior to perturbation analysis
Stimulation of nerves is usually marked by s2 and s3 (trains of stimuli). It is important to mark non-stimulated (control) steps as well, normally using s1 (single shocks).
Check-points before analysis is started
a) Note the consistency of stimulus delivery time-i.e. is it early, late or mid flexion or does it vary in each step. If it varies, you may have to manually select only those cycles in which the stimulation occurred at the optimal time.
b) Select range for analysis-a bout of locomotion/scratch where there is a fairly consistent pattern of flexion and extension. Often you will see that the “baseline” locomotion activity varies a lot during one bout which limits you in taking only specific portions into account when analyzing the effects of perturbations.
c) Look for control steps that were not triggered properly-i.e. sometimes there is an extra trigger after the real stimulus and the control trigger falls within a step that was actually a perturbed step. The only way to see this is manually go through the run, visually identify these false triggers and when selecting the trains in cycle spike setting, use the manual option from the train setting menu to delete these false stimuli. Note that this also means, that if there are false triggers in a run, you cannot use a script to analyze the data.
d) Set the list of waveforms that you want to average otherwise by default the program generates averages for all of them and if you have too many waveforms you may not be able to visually display them in the quick measure program.
e) Look for a script - pert_loco or per_scratch scripts were designed to use for analysis of perturbation.The script has values for stimulus marker levels:
stimulus 1 (s1): start threshold: 255, end threshold: -255, discriminator: -668
stimulus 2 (s2): strat threshold: 823, end threshold: 0, discriminator: 1692
stimulus 3 (s3): start threshold: 1896, end threshold: 0, discriminator: 0
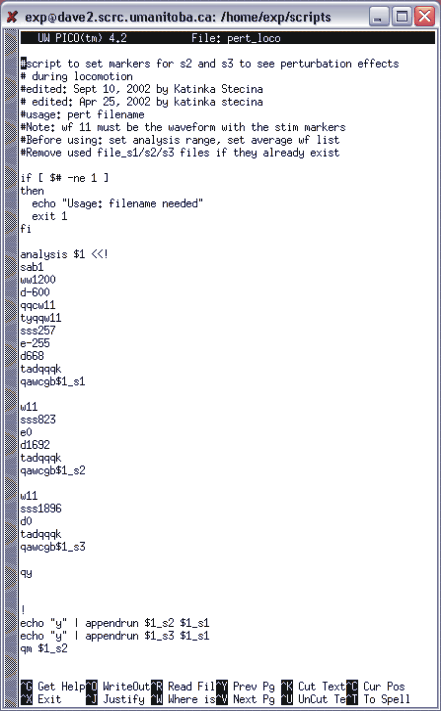
These numbers should work if the same stimulator is used and if the voltage offset (calibration) of the AtoD board is the same. The usage of the script is: pert_loco filename. It creates 3 files: filename_s1, filename_s2, filename_s3, appends the s2 and the s3 with the s1 and opens filename_s2 (appended) in QuickMeasure. There is an example of a script for analyzing locomotor perturbation with nerve stimulation in figure 11.1 below.
Figure 11.1. Example of locomotor perturbation analysis script
f) Finally, after visually displaying it with the QM program and selecting the range to show, you need to save these images as plt files (filename_s2.plt and filename_s3.plt). Then you need to use layout to create two equal size panels side by side, then fill them with filname_s2.plt and filename_s3.plt files. This you need to save as another plt file and you can import this into CorrelDraw to edit it for further figures.
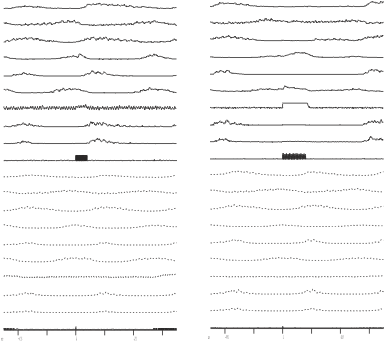
In the following section of this tutorial, we will walk you through the analysis necessary for assessing the effects of peripheral nerve stimulation on rhythmic locomotor activity. This is very similar to what the script is accomplishing but here you will be instructed to select the stimulus markers and perform the analysis manually, instead of using a script. The data file to use with this tutorial is called dts0105. In this run, there were two peripheral nerves stimulated, s2 was used to mark the stimulation of TA (tibialis anterior) nerve at 5 time threshold (t) and the s3 marker was used to note the stimulation of the EDL (extensor digitorium longus) nerve also at 5t. This information you can see in the descriptor of the dts0105 file. Also, note that stimulation was triggered off of the PerL (that is peroneus longus muscle nerve) ENG recording, a nerve active mainly during flexion in locomotion.
11.2 Select stimulated and control cycles markers
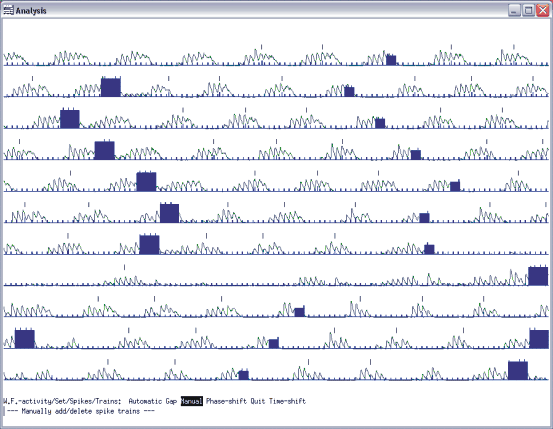
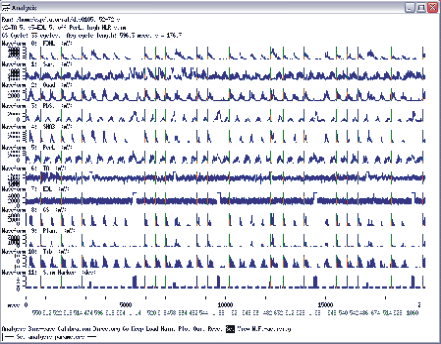
Open the dts0105 data file. Select the range from 52 to 102 s, because it is the period when the peripheral nerves were stimulated as the stimulus markers show it. To set the cycle markers, select waveform number from the main menu, enter 11, the stimulus marker waveform, and select set, spikes, visually. With the cursors, set the spike threshold, the hysteresis and the discriminator so that the largest trains show up yellow. If you are having trouble with the cursor settings visually, you can just select start threshold and enter 1896, then for the end threshold enter 0, and for the discriminator enter 0. Then if you hit visually, you should see an image as in figure 11.2.
Fig 11.2 Stimulus marker selection
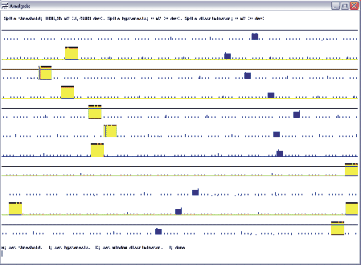
On this screen print in figure 11.2, you see the yellow bars as the selected markers, representing the stimulation of the EDL nerve. You will use this marker (spike) to crate a spike-triggered average of the waveforms of interest. Quit the spike setting menu and set the trains by selecting train, automatic, and done. Next save the settings as you go back to the main menu of analysis.
a dts0105, A,R,G,S,R,S,52s, <CR>, E, 102s,<CR>, Esc,G, W,11<CR>,S,C,S,1896<CR>, E,0<CR>, D,0<CR>, V,D,T,A,D,Q,Q,Q,K,>CR>,K
11.3 Create averages
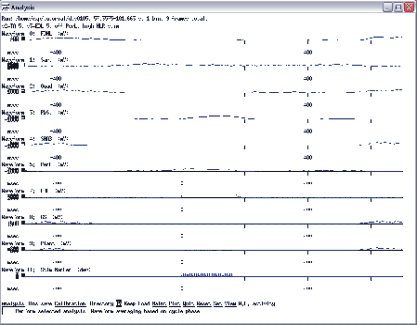
Next you have to set the waveform numbers you want to average. Select waveforms 0, 1,2,3,4,5,8,9 and 11 for averaging by going into the set menu and select average, waveform, list. Enter the numbers here then select window and enter 1200, then select delay and enter -500 here. The window and the delay will determine the time base for the average around the marker (spike) you are about to create. Set the reference waveform for cycle-based averaging by selecting set, cycle, waveform, and enter 11. Then select trains from the set/cycles menu and enter yes for the question “Base cycle selection on spike activity trains?”. This a little “trick” we use to select the stimulus marker trains as triggers for averaging. So, you will perform a spike triggered average but the actual selection is based on cycles of trains. Next you need to set the number of bins for the averaging to 1. And now, finally, you can create the average by selecting analysis, waveform-average, cycle-triggered, go. You should see a screen as shown in figure 11.3 with the averaged waveform activity of the selected waveforms over a window from -500 to 700 ms.
Fig 11.3 Waveform averaging based on a stimulus marker
You should bin-save this as “dts0105_s3” for further analysis.
S,A,V.L,0,1,2,3,4,5,8,9,11,<CR>,W,1200,D,-500, Esc,S,C,W,11,T,Y,Esc,S,A,B,1<CR>; Esc,A,W,C,G,B,”dts0105_s3”
Now, you have created an average based on the s3 stimulus marker showing what happened to the waveform upon the stimulation of the EDL nerve. In order to compare this to control cycle averages and to steps with stimulation of the TA nerve, you will have to repeat the above steps for the other 2 markers. The only difference in the steps to take for the analysis is the setting of the spike marker cursors. You will need different thresholds and discriminations for the s2 and set the spikes so you only select these markers. If you go into waveform:11, set, spikes, start threshold: 823, end threshold: 0, discriminator: 1692, then set the trains automatically and save these setting as you go back to the main menu. Then create the averages and bin-save it as “dts0105_s2".
11.4. Setting the control (non-stimulated) cycle markers
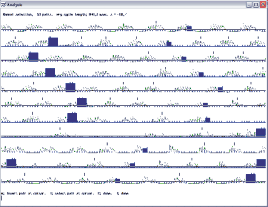
In theory, this step is just as simple as the above two steps when you set the markers for the stimulated steps. However, practically, it needs a bit more “tailoring” to eliminate false control steps. First you need to overlay a good flexor waveform, PerL (proneous longus) for example with the stimulus markers so you can see all the steps. Select set, display, waveform, overlay and enter 5. Then you will have to set the spike threshold and discriminator levels after selecting waveform:11; set, spikes. Use 355 for start threshold, and -217 for end threshold, and 590 for discriminator. After clicking done, select the train, automatic option and you will see a screen as in Fig 11.4a with a little hash line above all the selected markers. Green is the PerL waveform overlaid on the stimulus marker waveform (blue).
Fig 11.4a
Next you will have to delete some of these little hash lines, because some marked steps were not ‘good’ steps. If you look at the raw waveforms, you will see a period where the locomotor activity was almost completely missing for a period, with no good burst from either flexors or extensors. You should go through every step visually, and assess if you accept it as a good control step or not. Also, keep an eye on the timing of the stimulus marker in relation to the time it occurs during the step cycle. For example, if the stimulus marker occurs in late flexion in a few steps, but in mid flexion in the majority of the steps, that will skew your average. So, to delete some of the markers, you have to select done in the trains/automatic menu, then select manually, and use your middle mouse boutton or letter B to select a hash-mark and delete it with letter D. If you look at figure 11.4b you can see which ones we decided to exclude. This figure only shows the hashmarks with the steps that were kept as controls steps.
Fig ure 11. 4b
There are a few steps deleted towards the end of the recorded locomotor bout because they looked like double bursts or because they were too short compared the majority of the steps. This method (deleting spike trains with the manual option) also could work if you wanted to delete some of the stimulated step markers, because you did not want them in the average. For example, if a nerve stimulation had one kind of effect on the step cycles in certain steps but other kind of effects in other steps, with this manual selection of the spike trains, you could make separate averages for each kind of action. But, going back to the task here, you should hit done in the trains/manual menu, and go back to the main menu of analysis and save these settings for waveform 11. Next, perform the averaging with analysis, waveform-average, cycle-base, go. Then save this as “dts0105_s1.”
Esc,S,D,W,O,5<CR>Esc,W,11<CR>,S,S,V,S,355,<CR>D,590,<CR>E,-217,<CR>,D,T,A,D,M, delete the unwanted marks with cursors, D,Q,Q,Q,K,<CR>,Q,A,W,C,G
11.5 Using quick measure and layout for the cycle average figure composition
Once you have all three files bin saved, you will have to append the stimulated-step averages with the control-step averages. You should quit the analysis program and save the new parameter file as you quit and first append the s3 simulation averages with s1 by typing “appendrun dts0105_s3 dts0105_s1". Note that it is important to append in this order, so you will not alter the original dtc0105_s1 file, because you will use that file again when you append it with the s2 marker averages. So, next type “appendrun dts0105_s2 dts0105_s1". Now you have created two files that you can open in the Quick Measure program and you can compare the stimulated step averages to the control steps. Type qm dts0105_s3 and you will see a screen as shown in figure 11.5a.
Figure 11.5a Appended stimulated step and control step averages
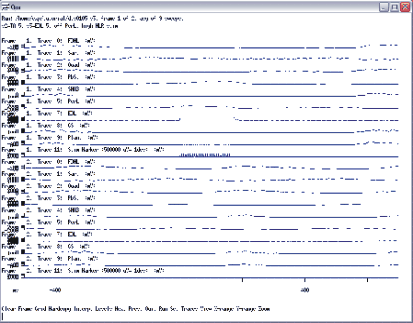
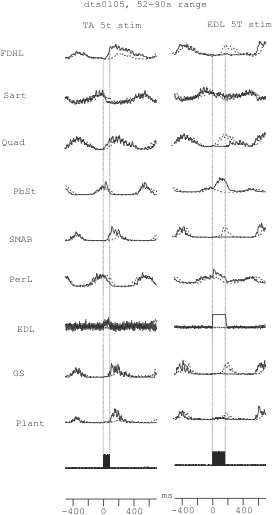
The traces labelled frame 1 show averages when the s3 marker was the trigger, and the ones labelled frame 2 show averages when the s1 stimulator was the marker (i.e. they are the non-stimulated steps). Next you will save this file as a plt file for further editing. Select Hard-copy from the main menu of Qucik Measure program and then select file and enter “dts0105_s3.plt”. Then select set from the menu and select file and enter dts0105_s2 to open the other files with the averages. Next save this as “dts0105_s2.plt” using the hardcopy/file options.
Then quit the Quick Measure program and open the Layout program. In layout, add two panels, each taking up about 50% of one page. Then fill the two panels with dts0105_s2.plt and dts0105_s3.plt files. It does not matter which goes into which panel, as long as you remember. Then if you select view, both from the main menu of layout, you should see as image as in 11.5b.
Figure 11.5b Layout images of the averaged waveforms
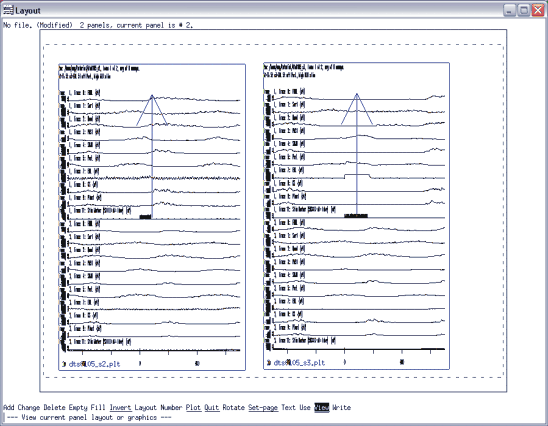
This layout format shown here has dts0105_s2.plt on the left side and dts0105_s3.plt on the rigth side. Then you need to save this file as dt105_wfavg.plt by using the plot, file options in the menu. Then quit the layout program and when you are prompted to write before quitting, select yes and save this as l2 (the rational for this is that l stands for layout image and the 2 stands for 2 panels on page, but you can name it any other way you want to). Next you will have to take the dt105_wfavg.plt file and transfer it onto a computer where you can work in CorelDraw or any other program you can open a plt file in or import into (see our webpage for more info on these types of programs and file compatibility if you do not want to use CorelDraw).
appendrun dts0105_s3 dts0105_s1, Y, appendrun dts0105_s2 dts0105_s1, qm dts0105_s3, H,F,dts0105_s3.plt, S,F, dts0105_s2, H,F, dts0105_s2.plt, Q, layout, A, make panel 1, #, 1, <CR>, position panel 2 next to panel 1, D, Esc, F, 1<CR>, dts0105_s2.plt, <CR>, F,2,<CR>, dts0105_s3.plt, Esc, V,B,H,F,dt105_wfavg.plt<CR>, Q,Y,Y,l2<CR>
11.6 Editing plt figures in Corel Draw
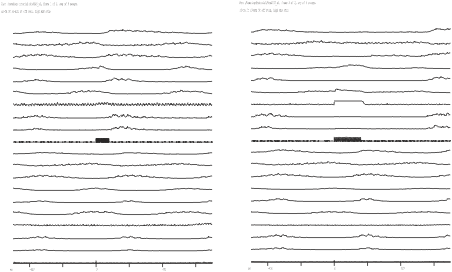
Import the dtf105_wfavg.plt file into the CorelDraw program. Ungroup the objects and select all the y-scales for each waveform and delete all of them. Select all of the text lines above each trace and remove them to the side so you will have only the traces under each other as shown in figure 11.6a.
Figure 11.6a Imported image with deleted y-scale bars and trace header lines moved aside in CorelDraw
Select all the traces that belong to the averages created during non-stimulated steps (all the traces below the s2 and s3 stimulus marker average lines except the s1 marker lines and the x scale bars), and change the lines from solid to dashed. You should see a screen as shown in figure 11.6b below.
Figure 11.6b Example of changing the solid lines to dashed of the control trace averages
Next, you will select all the dashed lines and overlay them on top of the solid lines. Best is to group all the dashed lines together and overlay all of them at once first, and then later, after un-grouping them, adjust each one separately for the best overlay. After you have overlaid the lines, you can edit the text lines (change the font size to 12, delete previous transformations) and delete unwanted portions (for example, we usually keep the abbreviated name of each averaged race i.e. LGS, PerL etc.). Then you can size all the lines and position them on the middle of the page for the best display as a data figure. An example of how the end result may look is shown in figure 11.6c below. Also, you may add dotted lines to mark the time of stimulation.
Figure 11.6c Example of overlaid control and perturbed cycle averages
11.7 Export cycle length data
In the previous sessions, you have visually assessed wether or not peripheral nerve stimulation had any changes on the step cycles. Next you will do a numerical assesment that may be useful for determining the effects of peripheral nerve simulation and assess wether it is a significant change in the steps.
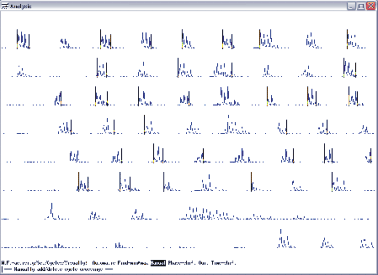
You will use the cycle durations to assess any difference between control and stimulated steps. Open the analysis program and load the dts0105 file. Set the range from 52 s to 90 s because this is a period of good rhythmic activity. First you will have to select the step cycles in a waveform that showed consistent, reliable, high amplitude activity in the ENG waveform recordings. Lets select waveform 8, LGS, lateral gastrocnemius, an ankle extensor muscle nerve, as the example for here. To set the cycles precisely, select Waveform-number and enter 8, then set, cycles, visually, automatic. Adjust the baselines and hit done. Next select manually, to make any changes for the cycles on or offset to be set. Figure 11.7 shows the step cycles selected. Note that after the silent period of nerve activity, we ignored all the steps.
After each step cycle is correctly set, save these setting and enter quit 3 times, this should take you back to menu with the header W.F.-activity. Here select the Export options, and select the cycles option. Then enter dt105_gs.txt to save the exported numbers in this file. Then quit the waveform activity subprogram and return to the main menu of analysis. Next you can quit analysis with saving the settings and you transfer the txt file you have just created to a computer where you can import it into a statistical program. Here, using Excel 2002 is described and some steps may be different if you are using a different program.
a dts0105, S.R.S.52s.<CR>,E,90s<CR>, W,8,<CR>, S,C,V,A,adjust baselines, D,M,adjust onset/offset for each step, D,Q,Q,Q,
Figure 11.7 Cycle settings for the GS waveform
11.8 Statistical analysis of cycle length data for stimulated and non-stimulated steps
After transferring the txt files with the exported cycle values, open this file in excel as a tab, space and comma delimited file with standard column data format. Figure 11.8a shows the screen you should get in excel if you successfully open the text file. This figure shows only some of the rows with the cycle values but you should have values down to row 55.
Figure 11.8a Example of imported cycle values in Excel
These numbers show the ms time values for the onset and offset of flexor activity as set in the reference waveform. To calculate the cycle duration, you have to subtract the start times from the consecutive start time values. To get the flexor burst duration within once cycle, you will have to calculate the difference between the start and stop times. To get the percentage of flexion in each cycle, you can calculate the duty cycle.
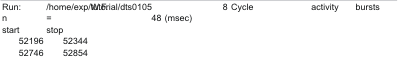
After calculating the duration for each step, you should separate the control step from the ones where peripheral nerves were stimulated. In order to do that, you will have to open in analysis the dts0105 again, go into the range from 52 to 90 s and display the cycles for the GS waveform. First enable the marking of the cycle onset times by selecting set, waveform, mark-crossings and enter yes. To display the set cycles, select set from the main menu, then select waveform-display, then select cycle-length and enter Y for yes. You will also have to have the reference waveform to be set for GS and for the cycles to be set in this waveform. Now if you do a raw display of waveforms, you should see the cycle duration values in green on the bottom of your analysis window, just above the main menu. Because of the range, the numbers are not really visible, so zoom in from 52 to 72 s and you should see a screen as shown in figure 11.8b.Print this screen and zoom in from 70 to 90 s and print this again. If you do not want to or cannot print the screens, just write down the cycle values and mark the ones that are EDL, or TA stimulated steps. Note that the displayed values in the Analysis program should match the calculated numbers you have gotten in the Excel file. If there is some discrpancy, then you should stop and figure out what went wrong.
Next you will take your printouts and in the Excel program, in the file you have created from the text file of exported values, you will separate the controls from the stimulated cycle durations into 3 different columns (control, TA stim, EDL stim). If you wonder why we have printed overlapping areas when we zoomed in, it is because sometimes you may miss a cycle duration value depending on your range displayed, so to avoid these “missing” cycles from your printouts, we have overlapped some of the “border” areas between two printouts.
Esc, S,W,M,Y,Esc,S,W,C,Y,Esc,A,R,G,S,R,E,72s<CR>,Esc,P,P,Esc, S,R,S,70s,CR>,E,90s,<CR>, Esc,A,R,G,P,P,
Figure 11.8b Displaying cycle duration values in the analysis program
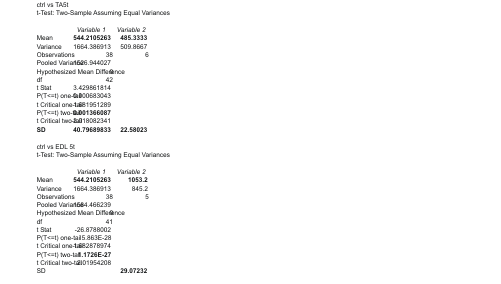
After separating the values in Excel into different columns, you can graph theses values to visually compare how the cycle duration changed in the stimulated steps. Also, you can compare the control series with the stimulated series using a t-test (two-sample assuming equal variance) to test for significant differences in the cycle duration values in these conditions. In figure 11.8c you see two examples of t-tests. One compares the control steps with the steps when the TA nerve was stimulated and the other compares the controls with the steps where EDL nerve was stimulated. Note that the mean for control steps is significantly longer compared to the mean during TA nerve stimulation, but significantly shorter compared to EDL nerve stimulation. Also, when you look on the graph shown in figure 11.8c, you can see that every time the EDL nerve was stimulated (triangles) the step cycles were longer than the controls and also when the TA nerve was stimulated (squares) the steps cycles were below the control step cycles values. So, this analysis shows that TA 5t nerve stimulation shortened ongoing flexion while the EDL 5t stimulation increased the ongoing flexor bursts. If you look at figure 11.6c, you can also state that the stimulation of EDL delayed the following extensor bursts in GS, Smab and Quad nerves and it increased the amplitude as well as burst duration of the PbSt and PerL nerves.
Figure 11.8c Example of statistical analysis and graphing of cycle durations
The above steps are also used when we analyze the effects of peripheral nerve stimulation on fictive scratch activity. Scratch is similar to locomotion in terms of the alternating flexor and extensor nerve activity, it is just at a higher frequency. The main difference in the analysis of scratch and locomotion is that you will have to set the gaps between spike trains marking control cycles to be shorter for scratch that it is set by default for locomotion. This is done in the waveform, set, spikes, trains menu, if you select gap, you can enter a number. For scratch, you should enter 10 ms. But all other aspects of the analysis are the same.