Tutorial 1 Displaying raw data and some scaling tricks
1.1 Displaying raw waveforms
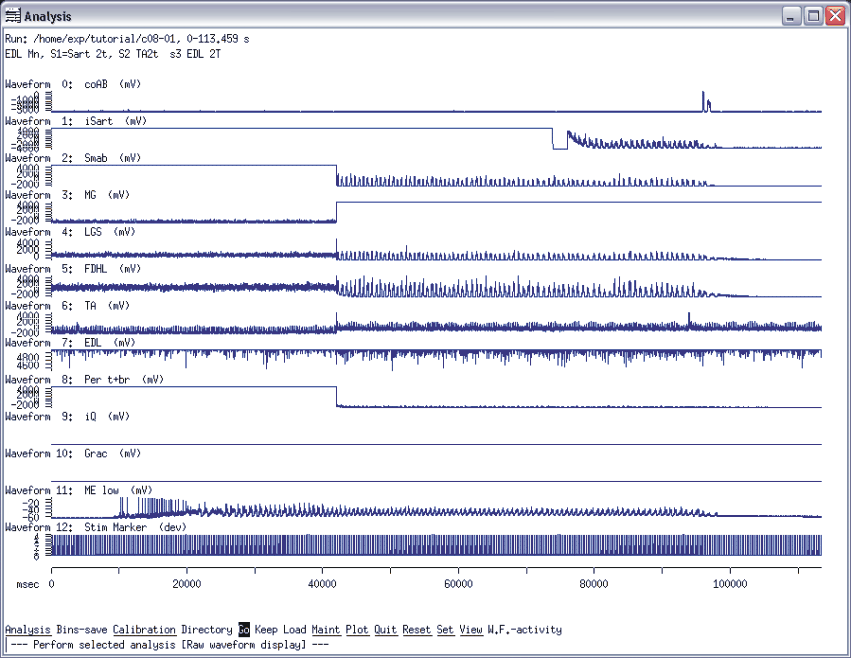
All the electrical recordings captured in the run named c08-01 as waveforms can be displayed in the analysis program. Fig 1.1 shows a display of raw waveforms. You can see the different waveforms--recordings from nerves--in the following order: contralateral anterior biceps (coAB), ipsilateral sartorius (iSart), semi-membranosus and ipsilateral anterior biceps mounted together (SMAB), medial gastrocnemius (MG), lateral gastrocnemius and soleus (LGS), flexor hallucis longus and flexor digitorium longus (FDHL), tibialis anterior (TA), extensor digitorium longus (EDL), peroneus tertius and brevis (Per t+br), quadriceps (iQ), gracilis (Grac). The ME low waveform refers to recordings taken with a microelectrode. Waveform # 12 is the Stimulus Marker–this refers to the various stimulators that were active during the experimental run.
Fig.1.1

As you can see, many of the waveforms--co AB, MG, TA, EDL Per t+b, iQ, Grac--showed no physiological activity but only baseline noise. Only Sart, Smab, LGS and FDHL will be used in the data analysis.
Before opening this run in Analysis, you should make sure that the c08-01 run files are in the directory you are working. To open this run in Analysis, you should first start the Analysis program by typing “a” in your Linux terminal window. Then you have to load the file you want to analyze. The Top Menu of analysis should be displayed on the bottom of your screen after opening Analysis and you should see the following options: Analysis Bins-save Calibration Directory Go Keep Load Maint Plot Quit Reset View W.F.-activity. Select Load and you will be prompted for the name of the data file you wish to analyze. Enter the name of the file: c08-01. Another way to open a file in Analysis is to type the filename c08-01 after typing “a” (i.e. “ a c08-01") in your terminal.
To obtain waveform display as in Fig 1.1, select Analysis from the Top Menu, then Raw, and Go. Now you should see a screen like Fig 1.1. In other words, the string of keystrokes you had to use was “a,r,g”.
Following in this tutorial you will the string of keystrokes after each exercise you were asked to do. These strings of keystrokes may serve as fast remainders for the commands used in a given exercise.
The second line in the top left corner of Fig 1.1 reading EDL MN, S1=Sart 2t,S2 TA2t s3 EDL 2T describes the experimental protocol in some detail (depending on how detailed the experimenters were). This descriptor let’s you know that we recorded traces from an EDL motoneuron with the intracellular electrode (EDL MN), stimulator 1 (s1) was set to stimulate the sartorious (Sart) nerve at 2 times threshold (2t) strength, stimulator 2 (s2) stimulated the tibialis anterior (TA) nerve also at 2 times the threshold (2t) strength and stimulator 3 (s3) stimulated the EDL nerve again at 2 times threshold strength (2T).
1.2 Selecting individual waveforms to be displayed
As you can see from Fig 1.1, not all the waveforms contain data that can be analyzed. You can select the number of the waveforms you wish to display and also the order you want to display them. If you look at Fig 1.2, then you will see that we have selected a few of the waveforms for display in the following order: LGS (a good extensor), iSart (a good flexor although its activity is not recorded until 80 s into the run). To get a display like Fig. 1.2, from the Main Menu, you should select Set then select W.F.-disp and then select List. Enter 4,1,11 then hit <CR>. So now you have selected the waveforms you want to see, in the order you want to display them on the screen. Now you have to go back to the Top Menu by using Esc and from the Top Menu you have to select Analysis/Raw/Go. Now you should see a display as in Fig 1.2. In other words the string of keystrokes you had to use for selecting the individual waveforms was the following: “Esc, s, w, l:4,1,11,<CR> Esc, a,r,g”
Fig 1.2
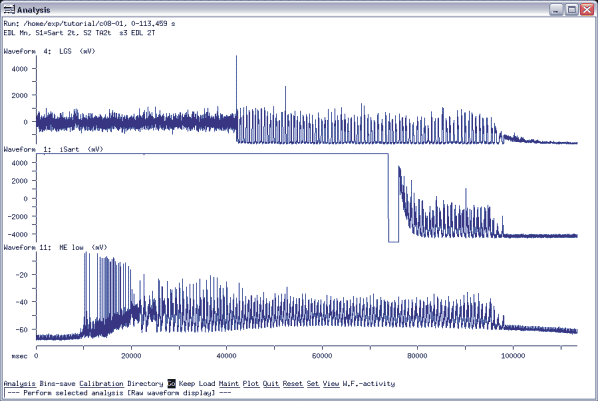
Note that if you wish to display all the waveforms you have collected, you can just enter “all” instead of listing all the numbers. Go to this link if you need more info: Raw Waveform Display.
1.3 Set display range on the X (time) scale
If you look in the left upper corner of Fig 1.1 and 1.2, you will see that it displays the name and location of the file and the time period you are looking at: 0-113.459 s. In order to display and analyze the whole run or a selected period of the run, you have to set the range of display. By selecting Set from the Top Menu, then Range then Start, you will see that it is set to “0" to defined the beginning of the recording as the beginning of the display. Hit <CR> and then select End. You should see that it is113459000ms or with other words it is “max” defining the end of the display range. Without knowing the exact time for the end you may use “max” and display the data up to the last point collected in a certain run.
You can enter the start and the end values by entering a number as msec or sec. By default, time units are set as milliseconds–so if you do not enter “s” after the value it will be read in as ms. If you want to see from 0 to 100000 ms, you can enter 0 or 0 s for start and 100000 or 100s for the end (faster to use 100s).
Keep in mind, that any analysis you want to perform looks at the range that you have defined. It is helpful that you check frequently the range you are analyzing to avoid mistakes. Later on you will be doing different analysis (waveform averaging, spike triggered averaging etc.) and you often will browse your data file to find the best section to analyze. Sometimes if you do not check the analysis range you will do the analysis for the wrong range. To avoid these mistakes it is good that sometimes you just display the raw waveforms to check that you are in the desired range. You can do that by simply doing :”a,r,g”.
We have selected the range from 44-94 s in this data set to analyze. Now you should set these boundaries: select Set from the Top Menu, and then Range and then Start. Set start to 44s and hit <CR>. Then select End and type 94s and hit <CR>. Then Esc back to the Top Menu and select Go (Go will preform the last analysis you have done, which was the raw-waveform display). At this point you should see a picture like Fig1.3. To get here, the string of keystrokes was: “s,r,s:44s<CR>e:94s<CR>Esc,g”
Fig 1.3
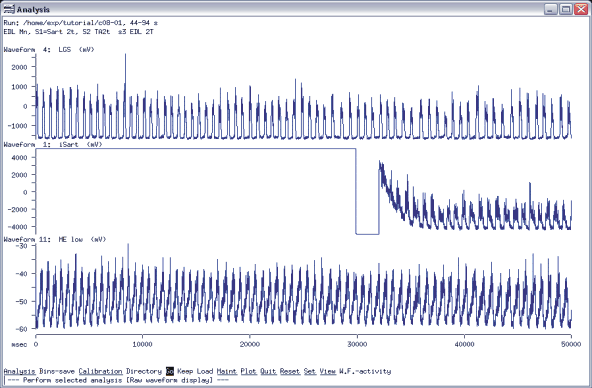
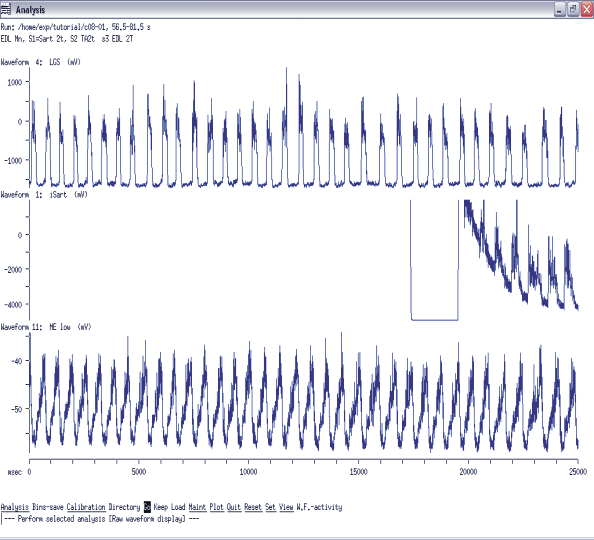
There are several Set/Range options implemented in the analysis program. By setting the ranges you change the resolution of the displayed data. The arrow keys (on the keypad) have been re-defined in analysis, to quickly change the analysis range. They are used at the Main Menu level so you do not have to go into the Set/Range Menu section to use them. Up arrows expand the time scale and down arrows compress the time scale (equivalent to the Set/Range/Half and Double operations). If you see on your screen a display from 44-94s and you hit the up arrow you will see a display from 56.5 to 81.5 s that is a total of 25 s–which is half of the original 44-94 (50) s period. Try this out now, hit the up arrow.
Left and right arrows move the display left or right through the data (equivalent to Set/Range/Prev/Go and Set/Range/Next/Go). Try this out now and hit the right arrow and you should see the data from 81.5 s to 106.5 s as displayed in the left upper corner at the end of the first line.
The arrow keys are convenient for quick zooming in/out but they could not be used in scripts. In the scripts we use the Menu items of the analysis program to change the range if needed (these menu items are the Set/Range/Previous, Next, Half, Double).
The "All" and "Undo" selections, under both Set/Range and Set/Range/Relative allow you to quickly set the range to the whole run (All), or revert to the range used during the next to last "Go" (Undo). If you go back to the Top Menu by hitting Esc and you select Set/Range/All/Go, you should see a screen just like Fig 1.2, showing the whole range of the data set. Now if you select Undo from the Set/Range menu, and then hit Go, you will see the range you had on your screen previously.
The Set/Range/Visually selection allows setting the start/end times or the length of the range based on a selected waveform’s activity. You will learn more about this option later.
Note that the"Go" in the Set/Range menu is there for convenience. It is the same as going back to the Top Menu of Analysis and performing a Go.
Try to use the arrow keys as well as the Set/Range options and zoom in/out and move along your data to get a feel for how these options work.
Selecting the range with Set/Range/Start and End shifts the X-scale of the waveforms. You can also use the Relative option in the Set/Range menu that keeps the display length constant while you change the starting or ending points of the display. You can set the value of Length that is used by the program.
Before you precede to section 1.5, make sure that you set the range to 44-94s. From the Top Menu select Set then Range then Start and set it to 44s. Then hit <CR> and select End. Set it to 94s and hit <CR>. Then Esc back to the Top Menu and hit Go. The string of keystrokes: s,r,s:44s<CR>e:94s<CR>Esc,g. You should see Fig1.3 on your screen before preceding to the next section.
There is more information about X-scale adjustments on the web under X and Y scaling if you wish to read it.
1.4 Adjust the Y scale of waveforms
By default the program auto-scales the Y (voltage) axes ensuring that the most positive and negative points for each waveform are plotted. The most annoying aspect of autoscale comes when you zoom in on a range of data. If autoscaling is still enabled, changes in scaling for the data subset often prevent a direct comparison of the two sections. Autoscale will determine the extremes of each waveform if you begin your analysis with the display of the raw waveforms. There is a way to turn off autoscale and to set the Y-range for each waveform. To turn off autoscale select Set/Disp-opt./Scaling/Autoscale: No/Esc and values that had been determined automatically will be used for waveforms and will apply to subsequent displays.
The Y scaling parameters of individual WFs are controlled in the Set/Disp-opt./Scaling/Y-axis menu. In practice, it is usually necessary to adjust the Y scaling of only one or two waveforms because the autoscaled values are often appropriate. Since autoscaling of the Y axis is enabled by default, changes to the scaling of individual waveforms will have no effect until autoscaling is disabled. Next you will change the Y scale for waveform 1 as seen in Fig 1.4. where waveform #1 (Sart) has a different Y scale than it had on previous displays. The scale goes up to 2000 instead of 4000 mV. In order to change the range you see on the screen, first you must disable autoscaling by selecting from the Top Menu Set/Disp-opt./Scaling/Autoscale and set it to No then Esc back to the Top Menu of analysis. Then to change the Y-scaling of the Sart waveform select Set/Display/Scaling/Y-axis/Waveform/Upper-bond: waveform number 1, then enter maximum level 2000 . Then hit <esc> to get to the Main Menu and hit Go to perform the raw waveform display. Look at the Y scale of waveform # 1 that should look like Fig 1.4. “<esc>s.d.s.a:N, Y-axis,w,u,”Enter waveform #”: 1<CR> 2000<CR>EscG”
Fig 1.4
1.5 View parameters
Start this section with a screen that looks like Fig 1.3. Display raw waveforms from 44-94s (if needed, you can do that by adjust the X-scale as described in section 1.4) and you should display the waveforms on the full scale (you should re-enable the autoscale option using the steps described in section 1.5).
Sometimes you will make a mistake in setting the parameters for an analysis. In order to find out what was wrong and why you did not get the proper analysis done, the program can display a list as seen in Fig 1.5 telling you all the parameters you need to have for the analysis you have performed last. The parameters in Fig 1.5 are the ones needed for the raw waveform display. To see this first level of parameter display you should hit Esc to get back to the Top Menu of analysis and then select View/Required. You should see the list of information as seen in Fig 1.5. The string of keystrokes to get there was : “Esc,v,r”.
Fig 1.5
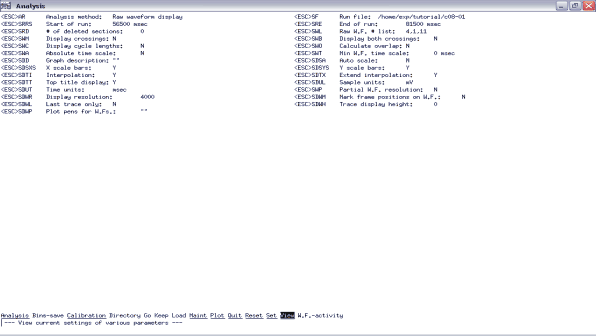
The second level of parameter display is when you select Display-options from the View menu. That shows the display of the parameters used for the way data is presented.
The third level of parameter display is the listing of all the parameters that can be set in the program. If you select View/All then you will get a long list of all the parameters with their current setting (note that your list does not end on the bottom of your screen). If a parameter has a question mark that means that its value is not set.
Displaying these parameters now may not make a lot of sense to you. This tool will be useful later when you are doing data analysis on your own and something is not working right. At this point we just wanted to let you know how you can view the information about the parameters you are setting in the analysis program.
After looking at the parameter list, you should Esc back to the Top Menu of Analysis and perform a raw-waveform display (a,r,g) to see a screen like Fig 1.3.
1.6 Displaying frames vertically over waveforms
Analogue signals can be digitized either as a waveform (i.e. continuously) or as a "trace", where the signal is digitized in bursts that are discontinuous, triggered by some signal supplied to the A/D board, and are of a user defined duration. (Sometimes data digitized as a trace is also called a "sweep" in slang since it is analogous to one sweep of an oscilloscope.) The main advantage of capturing data as a trace is that the phenomenon of interest is associated with a specific time period (e.g. that following a stimulus pulse). Then you can successively digitize those areas of interest at a high sampling frequency without digitizing the signal in time periods in between (when nothing interesting is happening).
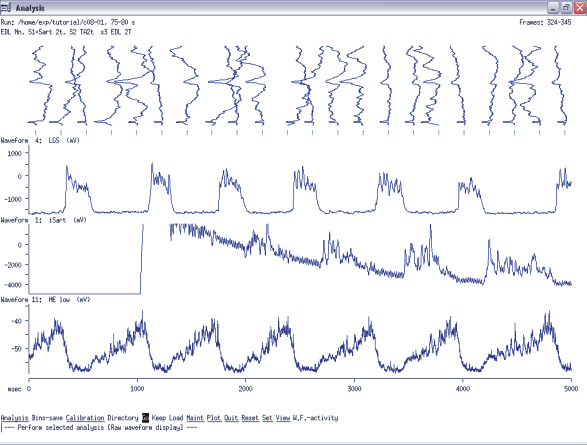
If you look at Fig 1.6, you see frames displayed on the top of the screen above the waveforms. The program attempts to line up the start position of each vertical sweep with the green vertical mark that indicates the start of a sweep along the upper most waveform. To see better the vertical trace display you should change the display range. Set the range from 75s to 80s. Esc back to the Top Menu and select Set/Range/Start 75s and End 80s then Esc back to the Top Menu. To enable the vertical display of traces–as seen in Fig 1.6 select Set/Display/Waveform/ Mark-frames:Yes/Esc/Go. The string of keystrokes you had to use was:“Esc,s,r,s:75s<CR>e:80s<CR>Esc,s,d,w,m:Y,EscG”. You should browse through the display range with your up and down keypad arrows to see the different look of the displayed traces based on the time scale you select. If your range is too large for example, the traces are very crowded and individual traces cannot be distinguished.
Fig 1.6
1.7 Bringing cursors to the screen to make measurements
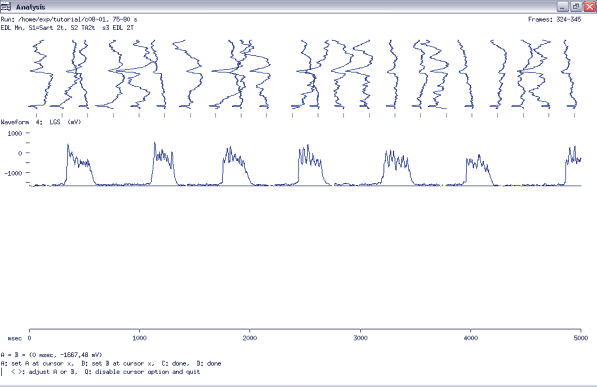
In analysis you can use the “.” key to bring a cursor onto the display screen. The cursors read measurements from only one waveform at a time. You can manipulate the cursors with the mouse or the keyboard as you see from the instructions on the bottom of the page in Fig 1.7. To get a screen that resembles Fig 1.7 you should hit the “.” (period) key. Then try to position the cursors and read off the measurements. If you hit D (done) or the most right bouton on the mouse, you should see the next waveform on the screen to be displayed. And if you hit done again, the last waveform will be displayed on the screen with the ability of placing the cursors along it. If you hit Quit, you will loose the option of cursor display. For most of the analysis we are doing it is better to use the QuickMeasure (qm) Program to obtain exact measurements. However, to make good approximations quickly within Analysis comes handy once in a while.
Fig 1.7
1.8 Filter and rectify waveform recordings
Sometimes you may need to filter and rectify the collected waveforms, especially when you have collected raw ENGs during the experiment. In the data file used for the tutorial there is no real need to filter and rectify any of the collected waveforms, but you will do it just to have an idea how it is feasible with the program. You will filter and rectify te ME low waveform, waveform # 11. You will create a filtered waveform as shown in Fig 1.8 below.
Fig 1.8
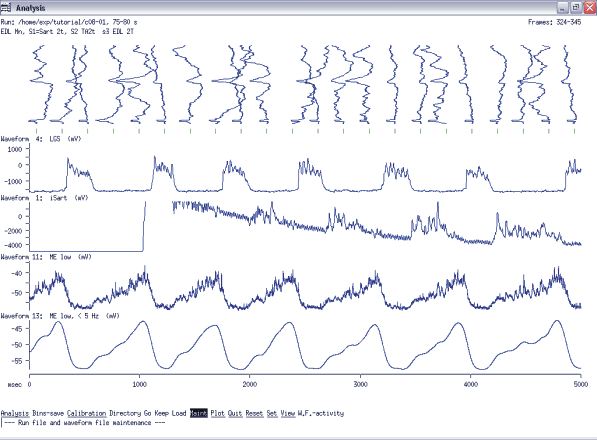
Select Maintenance from the Main Menu. Then select Filter, then select W for entering the number of waveform for data to be filtered. Enter 11 here then hit enter. Then select cutoff to enter the cutoff frequency for filtering. Use 5Hz here, but you may have to try several different values for the cutoff if you have waveforms that were recorded differently from this example. Then select divisor and enter 2. This will take only every other point in the run and will smothen your waveform activity. Then select rectify and enter yes. (Of course, in some cases you may not want to rectify your waveforms, then you would just enter no here.) Then select Go and you should be prompted for entering the number of new waveform. Here just enter 13, as it is set to the default. Note that by filtering a waveform, you will not delete the original one (you will just create a new data set for the filtered waveform). Then you should see on the bottom of Analysis window that it is “Filtering...”. This process may take a while depending on the length and capture rate of the waveform you wish to filter. In our example, it should not take long. After it is done, hit Esc to go back to the Top Menu of Analysis and then select Set, Waveform. List and add 13 to 4,1 and 11 that should be already entered. After this, perform a raw waveform display to see the new waveform you just created and you should have a figure like Fig 8. Note that the name of the new waveform contains the name of the original one and also contains the cutoff value you have used for the filter. The string of keystrokes to see a display as Fig 1.8 was the following: Esc, m,f,w:11<CR>c:5<CR>d:2<CR>r:Y,g,” Enter number of new waveform:” 13 <CR>, Esc, s,w,l: 4,1,11,13 <CR> Esc, a,r,g.